About
We do DATA
We develop data visualizations, custom API's, data analysis tools and infrastructure for our clients needs. Mostly we use Amazon's cloud (AWS) for server deployment. For specialized API's, such as dynamic translation or geoencoding we use Google's cloud (GCS). For visualizations on hardware we make native OS X apps or utilize an HTML5 canvas. Read on for a few examples.
私たちは、データの可視化、カスタムAPI、データ解析ツールや顧客ニーズに合わせたインフラ開発を行っています。サーバーデプロイメントの大部分ではAmazonのクラウド(AWS)を使用しています。動的翻訳やジオエンコーディングなどの特別なAPIではGoogleのクラウド(GCS)を使用しています。デバイス上で可視化する際には、OS Xのネイティブアプリを作成したり、HTML5のキャンバスを使用したりしています。いくつか例をお見せしましょう。
Tweet Radar
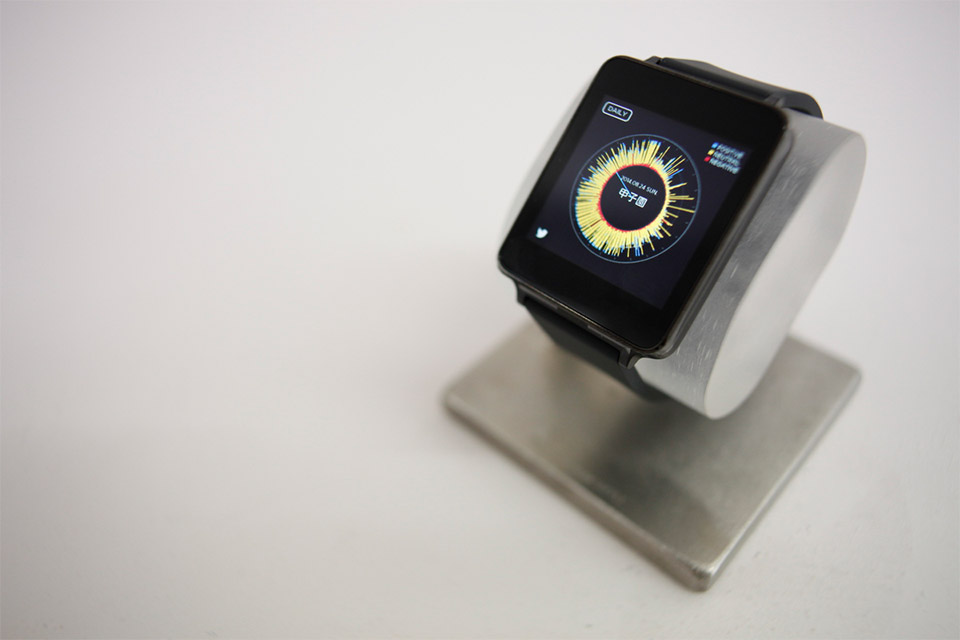
Tweet Radar for was developed for a promotional event organized by Dentsu. We created a data visualization of twitter data for the iPad and Android Wear. We began data collection based on a set of keywords (trends or brand names). The gathered tweets were then broken into 3 categories: positive, negative and neutral. Data was rendered in 24 hour blocks, in a circle like a clock. The volume of positive, negative and neutral tweets were calculated, color coded and rendered.
Tweet Radarは電通主催のプロモーションイベントのために開発されました。私たちは、iPadやAndroid Wearでツイッターデータの可視化を行ったのです。まずキーワードセット(トレンドやブランド名)に基づいてデータ収集を行い、集めたツイートを、ポジティブ、ネガティブ、ニュートラルの3つのカテゴリーに分類しました。そしてそのデータを24時間ブロックとして表現し、時計のような円形画面に表示しました。肯定的、否定的、中立のツイートの量を計算し、色分けして表示したのです。
We choose this method of visualization to make trends obvious. The most frequent tweets were shown individually. The circular design fits perfectly with the smart watch.
私たちは、トレンドをわかりやすくするために、この方法で可視化を行いました。最も頻繁に行なわれているツイートは個別に表示するようにしました。円形のデザインは、スマートウォッチの画面に完璧にフィットするものです。
We designed and deployed the server infrastucture, wrote programs to monitor and analyze data from twitter, developed text analysis software for sentiment analysis, created APIs to relay the data to the client and finally implemented visualizations for the iPad and Android Wear. Because we handled both back and front ends in house we were able to provide a seamless solution.
私たちは、サーバーインフラの設計とデプロイを行い、ツイッターから流れてくるデータを監視して分析するプログラムを書き、感情分析用のテキスト解析ソフトウェアを開発し、データをクライエントに中継するAPIを作成し、そして最終的にiPadやAndroid Wearでの可視化を行いました。バックエンドとフロントエンドの両方を自分たちで処理したおかげで、シームレスなソリューションを提供することができました。
Legends Stadium
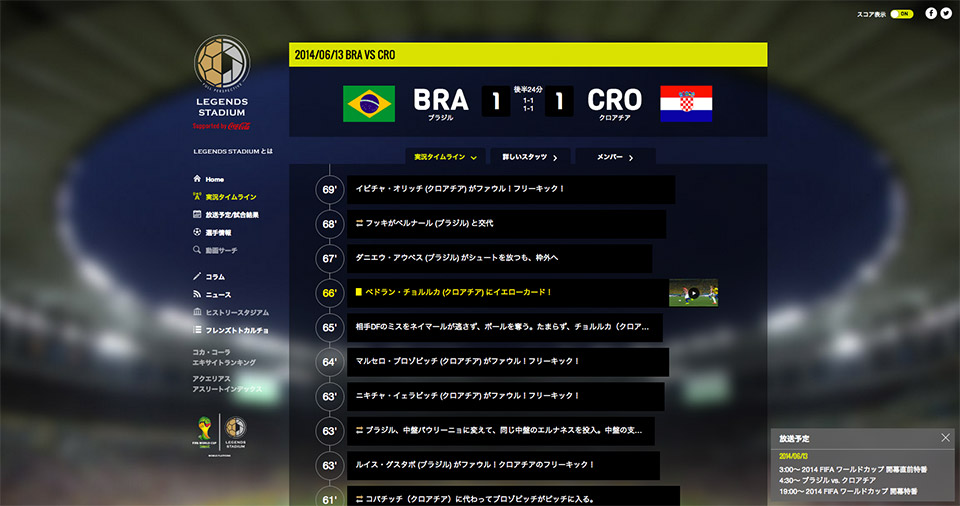
Legends Stadium, now permanent site devoted to soccer, began as a project for the FIFA World Cup 2014. Our goal for 2014 was to show video from the major plays of the game in a timeline format from all available camera angeles - in retaltime.
レジェンドスタジアムは、今ではサッカーファンのための常設サイトになっていますが、これはFIFAワールドカップ2014のためのプロジェクトとしてスタートしたものです。2014年におけおる私たちの目標は、ゲームの中で様々な角度から撮影された主要プレーのビデオを、タイムライン形式で、しかもリアルタイムに表示するということでした。
Data was gathered and processed from a multitude of sources. Video feeds, game statistics for all players, play by play game data, ball position and so on. We were responsible for monitoring and processing these data feeds, then visualizing and providing an API for client platforms (web, native iOS and Android)
データは複数のソースから収集し、処理を行いました。例えば、ビデオフィード、全プレーヤーのゲーム記録、ゲームの実況データ、ボールの位置などです。私たちの担当は、これらのデータフィードをモニターして処理をし、それらをクライエント・プラットフォーム(ウェブ、iOSやAndroidのネイティブアプリ)で可視化したり、そのためのAPIを提供したりすることでした。
KOKUYO Umeda Showroom
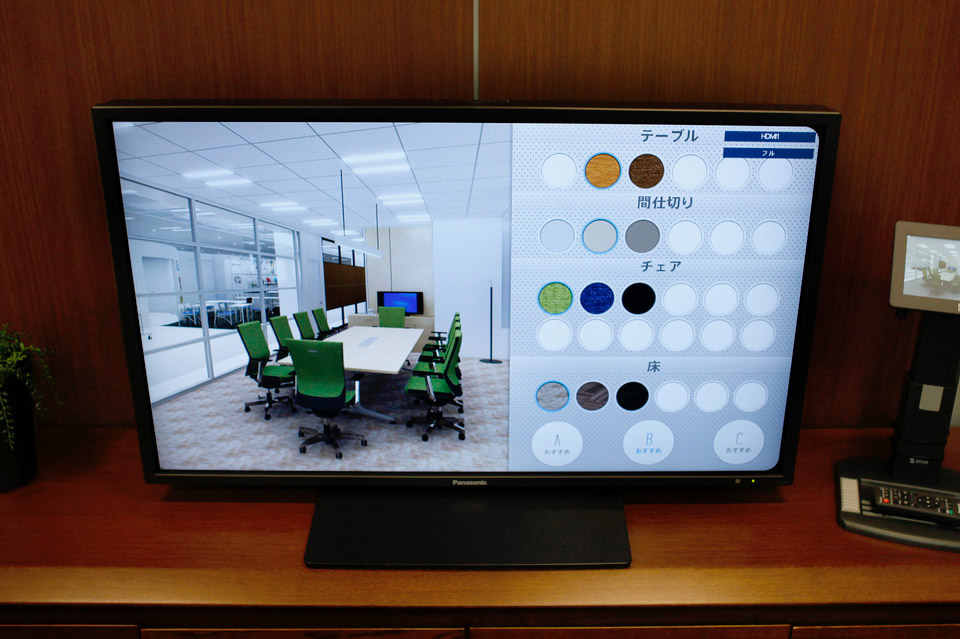
Kokuyo has a modern showroom in Osaka in the Gran Front building. The showroom is used to showoff Kokuyo's furniture and office planning expertise. In order to facilitate the showroom tour we installed beacons throughout the space and built a custom tablet based app.
コクヨの近代的なショールームがグランフロント大阪にあります。このショールームは、コクヨの家具やオフィスプランニングの技術を人々に知ってもらうためのものです。このショールームのツアーを支援するために、私たちはショールーム中にビーコンを設置し、タブレットベースのカスタムアプリを作成しました。
The tablet is carried by the guide and shows them where they are and where to go next. The app also suggests questions to ask the potential client, and based on their responses suggests a tailored path through the space. The app also controls media elements, such as the triggering of video playback. At the end of the tour a heatmap is generated showing how the guests time was spent in the space.
タブレットはガイドが携帯するもので、現在の位置や次に何があるのかを示してくれるようになっています。また、タブレットのアプリには訪問客に対する質問が表示されるようになっており、その答えに基づいてショールーム中を移動するための最適な経路が示されます。さらに、このアプリでは、ビデオ再生をスタートするなど、空間に設置されているメディア要素をコントロールすることもできます。ツアーの最後にはヒートマップが作成され、ゲストがそれぞれの場所でどれだけの時間を過ごしたかを見ることができます。